Written by Leesa Harwood, Owner of By The Waves Charity Consulting.
Too much of a good thing
Data is great. It underpins good decision-making. It helps fundraisers to understand supporters, articulate impact, measure success and prioritise the deployment of finite resources. But you can have too much of a good thing. Today we have access to lots of data, but nowhere near enough insight. Alexander Chancellor, former editor of The Spectator said:
“Excessive information creates its own form of blindness to what is actually going on.”
Now, charity professionals are faced with so much data, that they simply can’t see the wood for the trees. They are data blind.
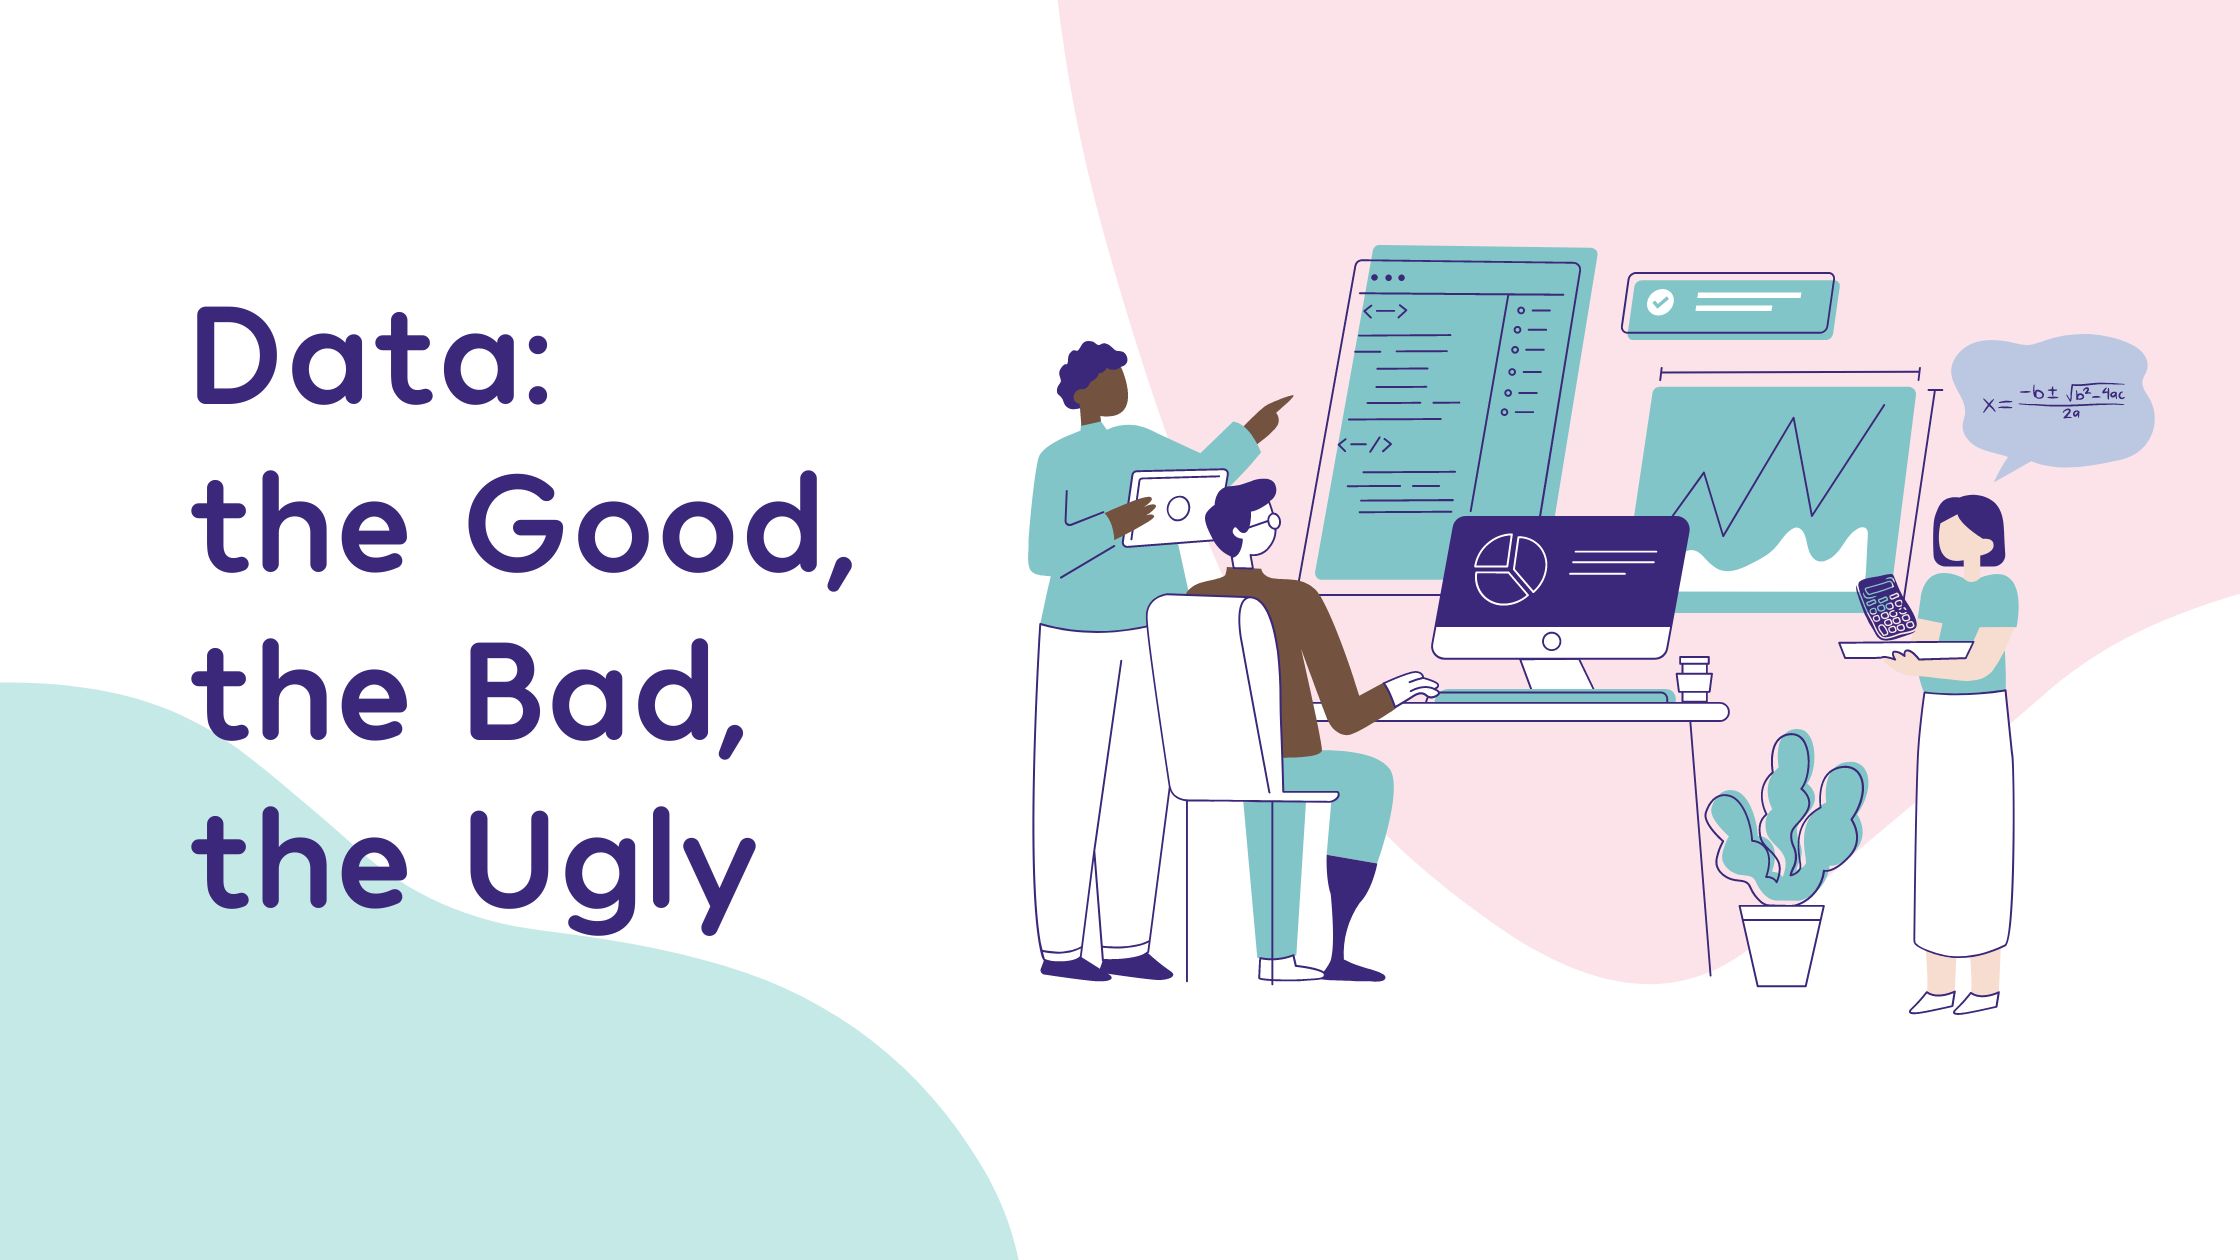
Good, Bad & Ugly
With so much data available, sorting the good from the bad can be challenging. This summer I sifted through over 85 data sources, reports, and documents to compile After the Storm, a summary of key, socio-economic trends and their implications for charity leaders. I am not a data scientist. My background is charity leadership and fundraising, so it was hard going. The more reports I read, the more I realised that data and research can be divided into three categories:
“Excessive information creates its own form of blindness to what is actually going on.”
Alexander Chancellor, former editor of The Spectator
Good
Good data goes beyond a presentation of facts and figures. It evolves into information and then insight. In starts with a fact, then answers the question ‘so what?’ then articulates a clear implication. Good data is based on viable samples, objectivity, and curiosity. It closes the loop between asking a question, analysing facts to find an answer, then adding a big dose of common sense and context to draw a conclusion. It doesn’t just provide information, it delivers enlightenment. Researchers produce good data with one eye on the audience and the problem they’re trying to solve. They adapt their language to present their findings in a relevant and engaging way for their target audience. They know where they can add value and they set out to do so from the start.
Bad
Bad data is everywhere. Vast quantities of facts, figures, graphs, and charts couched in impenetrable language that makes your eyes spin and your ears bleed. Bad data is not necessarily incorrect or corrupt data. It’s just not useful. It is often compiled and presented by incredibly clever people who know their subject matter but not their audience. You have to work hard to optimise bad data. Finding it, translating it, processing it, then applying it to your world or problem. Usually, the ‘so what?’ answer is buried in so much jargon that you give up and go home.
Ugly
This is the worst data of all because can be misleading and fake. It falls into three categories:
1. Clickbait
A headline loosely linked to some random statistics picked from a survey using questionable methodology. Great at grabbing headlines, a data capture tool and a way of inflating click-through statistics.
2. Tiny sample
Survey results with tiny sample sizes are useless. There are over 160,000 registered charities in England and Wales, and yet some high profile, sector bodies persist in presenting conclusive trend data based on samples of less than 50 charities. This is literally not big, and not clever.
3. Pre-determined answer
Usually companies or suppliers commission research or surveys with a specific result in mind. Usually that result nudges you to buy their product. It’s unfair to suggest that all supplier-commissioned research falls into this category. But if a business produces a survey that aligns with its marketing content, it’s always sensible to cross check with an alternative data source just in case.
Data is fickle. With enough manipulation, the right lens and selective bias you can make data say pretty much anything.
Torture the data and it will confess to anything
Data is fickle. With enough manipulation, the right lens and selective bias you can make data say pretty much anything. But as fundraisers, we rely on it to keep us current, efficient and honest so it is important that we know where to go to find good data and how to use it properly. By learning to recognise the good, the bad and the ugly fundraisers will always use the right data to answer the right questions at the right time.